plotgui
Purpose
Interactive data viewer.
Synopsis
fig = plotgui(data)
fig = plotgui(data,'PropertyName',PropertyValue,...)
fig = plotgui('update','PropertyName',PropertyValue,...)
Description
Plots input data dat and provides a control toolbar in the Plot Controls
window to select portions of the data to view. The toolbar allows interactive
selection, exclusion, and classing of rows or columns of data. The PLOTGUI command has various
display options that are given as 'PropertyName', PropertyValue pairs or
as a single keyword. Properties and Keywords are discussed below. To modify
options for an existing PLOTGUI
figure without providing new data, use the 'update' keyword.
PLOTGUI
returns the handle of the figure in which the data is displayed (fig).
Input dat
can be class “double” or “dataset”. The description given below is generally
listed for two-way data arrays. Options specific to data that are three-way or
image are noted explicitly. PLOTGUI
uses the dataset labels, classes, etc. when dat is class “dataset”.
Plot Controls Toolbar
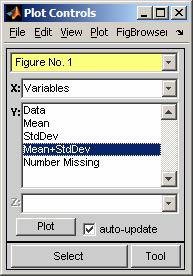 The toolbar consists of 1) a menu bar with File, Edit,
and View menus, 2) a figure selection dropdown menu, 3) three axis menus
(labeled x, y, and z), 4) plot update controls Plot
button and auto-update checkbox, and Select button.
The toolbar consists of 1) a menu bar with File, Edit,
and View menus, 2) a figure selection dropdown menu, 3) three axis menus
(labeled x, y, and z), 4) plot update controls Plot
button and auto-update checkbox, and Select button.
Each figure in the figure selection dropdown menu menu can be
modified by the PLOTGUI
controls. Selecting a figure from this menu will bring that figure into view
and indicate the selected axis menu settings. A "+" or a
"*" next to a figure's name indicates that it is linked with
another figure (see Duplicate Figure below).
The axis menus (labeled x, y, and z)
select what parts of the data should be used for the plot. Each column or row
selected in the y-axis menu will be plotted against the column, row or index
selected in the x-axis menu. If any selection is made on the z-axis menu, then
each y-axis selection is also plotted against the column or row selected in the
z-axis menu to make a three-dimensional plot.
If the input dat
is three-way it is assumed to be a multivariate image, and the y-axis is slice
or slab and the figure default is imagesc(dat(:,:,1)). This is also true if dat is class “dataset” with
the type field set to 'image' or 'image'.
If the auto-update checkbox is selected, figures are
updated automatically when new axis-menu selections are made. Otherwise, the Plot
button must be pressed before any changes are reflected in the figure.
View Menu
Various options associated with the viewed data are contained
in the View menu. The specific options depend on the data being plotted.
The View menu options are listed below.
Table: Opens a Plotted
Data window that lists the numerical values of the plotted data.
Numbers: Displays the index number
next to each plotted point.
Labels: Displays available
lables next to each plotted point. If no labels are available this option is
greyed out.
Classes: Uses available class
information to give each plotted point a different symbol. If no class
information is available this option is greyed out. The fly-out menu includes
any class sets defined in the dataset as well as options to "Outline Class
Groups". Group outlining allows drawing of lines to either enclose all
samples in a group ("border points") or as a confidence boundry
("confidence ellipse").
Declutter Labels: Controls the label/number
decluttering options. Automatic modes remove labels when they overlap.
"Selected Only" removes labels on all points except those which have
been selected using the standard selection tools.
Label Angle: Changes the angle of (i.e.
rotates) all labels in a plot.
Excluded Data: Shows any points which have
been “excluded” from the data set.
Axis Lines: Places lines through the
origin.
Log Scales: Switches axes between log
and linear scaling.
Auto y-scale: When enabled, all plotted
data items are scaled so that their y-axis values are on a similar scale (that
is, they are each baselined and normalized). The different methods for
y-scaling include: Sum, Length, Max. In each case, the given property is set
equal to 1 for each plotted data item. In addition, if the plot has been
zoomed, the y-scaling method is based only on the currently visible data. The
scaling can be recalculated for any given zoomed view by selecting "Scale
from current zoom".
Auto Contrast: Contrast enhancement for a
slice/slab for multivariate images (only available when the data are 3-way or
type image).
Duplicate Figure: Creates a duplicate copy of
the current figure that is linked to the current figure i.e. if one figure is
modified the other automatically changes to reflect the modification. The
parent figure will have a "+" next to its name in the figure
selection dropdown menu and the child figure will have a "*".
Spawn Figure: Creates a duplicate copy of
the current figure that is not controled by the Plot Controls toolbar.
This is a simple MATLAB figure.
Dock Controls: When checked, the Plot
Controls toolbar are “docked” next to the controled figure.
Settings: Allows the user to
modify other view settings.
Plot Menu
Selects the "mode" in which the current data should
be viewed. This can be either a summary of any given mode (Data Summary mode)
or one of the standard modes of a data matrix including the rows, columns, or
slabs.
Data Summary: Plots all the data, the mean,
the standard deviation, or the mean ±
the standard deviation. For Variables (columns) or Samples (rows) depending on
what is selected in the x-axis.
Rows: Plots the data across
rows selecting which rows (usually samples) to view.
Columns: Plots the data down the
columns selecting which columns (usually variables) to view.
Slabs: Uses IMAGESC to view a slice/slab
of a 3-way array (only available when the data are 3-way).
Selection using the Select button
The Select button allows the user to select plotted
points in the current figure. After clicking Select, the current figure
will be brought to the front and points are selected using the current
selection tool (selected using the Tool button; see also Edit/Selection
Mode menu). To extend a selection (i.e. add new points to the already selected
points), use the shift-key while pressing the mouse button. To remove
points from the selection, use the control-key while pressing the mouse
button. To keep from making any selection, press "Esc" or
"Escape".
Edit Menu
The Edit menu contains various actions relating to
selections. The specific actions available depends on the current selection and
PLOTGUI mode. The Edit
menu options are listed below.
Select All: Selects all plotted
points.
Deselect All: Deselects all plotted
points.
Select Class: Select all points of a
given class or classes in the data (if any classes are defined).
Select Excluded: Selects all points which are
currently excluded (see View/Excluded Data).
Selection Mode: Menu used to choose selection
mode from the following:
Box: Click and
drag a rubber band box around points,
Polygon: Click to
mark the corners of a polygon around points and click on the intial point or
press [Enter] to close the polygon,
Circle: Click to
mark center of a circle, then click to mark the outside edge of the circle,
Ellipse: Click to
mark center of an ellipse, click again to mark the minor axis size for the
ellipse, then complete the selection by clicking to mark the size and direction
of the major axis for the ellipse
Paintbrush: Click
and drag to "paint" a selection onto points,
Lasso: Click and
drag a free-form line to "ensnare" the points,
Single X: Click to
select a single point on the x-axis,
Single Y: Click to
select a single point on the y-axis,
X Range: Click and
drag to select a range of points on the x-axis,
Y Range: Click and
drag to select a range of points on the y-axis, and
Nearest: Click to
select the nearest point.
Multiple Nearest:
Click to select the nearest point, repeated until the [Enter] key is pressed.
Include All: Includes all excluded
points (whether or not they are selected).
Exclude Selection: Excludes (soft deletes) the
selected points from the data set. See View/Excluded Data.
Include Selection: Includes the selected points in
the data set. See View/Excluded Data.
Include
Only Selection: Exclude all unselected points from the data set
i.e. keep only the selected points.
Info on Selection: Get information on selected
point (only available when a single point is selected).
Set Class: Set the class of the
selected points.
Exclude Plotted Data: Excludes all items currently
selected in the y-axis menu for plotting. Note that unlike the other exclusion
options in this menu, this and the next two options act on the mode selected in
the Plot menu.
Include Plotted Data: Includes all items currently
selected in the y-axis menu for plotting.
Include Only Plotted: Includes all items currently
selected in the y-axis menu for plotting and only those items (all others are
excluded).
File Menu
The File menu contains various actions relating to
files. The File menu options are listed below.
Load Data: Creates an interface for
the user to load data into PLOTGUI
from the base workspace or a file.
Save Data: Creates an interface for
the user to save data from PLOTGUI
to the base workspace or a file.
Open in Editor: Opens the given dataset in a
linked DataSet Editor window.
Export Figure: Allows exporting the current
figure to Various external programs (exporting will not function correctly if
the given program is not installed on the computer).
Save Selected Indices: Saves the current selection
as a vector of indices. This can be used with the Load Selected Indices command
to quickly store and reload different selections.
Load Selected Indices: Load a vector of indices to
use as a selection.
Reset Controls: Refreshes Plot Controls. Useful if
graphical objects are not correctly aligned.
Properties and Keywords
The following is a list of available properties. Each should
be included as a 'PropertyName', PropertyValue pair in an initial PLOTGUI call or a PLOTGUI 'update' call. Note
that calls to PLOTGUI
for 'PropertyName' and PropertyValue are case insensitive.
The current value of almost all properties can be retrieved
using the getappdata
function on the PLOTGUI
figure and requesting the property of interest. Note that calls to GETAPPDATA are case
sensitive and 'PropertyName' must be in all lower-case. The I/O format
is:
currentvalue = getappdata(fig,'propertyname')
where fig
is the handle of the PLOTGUI
figure. If 'propertyname'
is not included getappdata(fig)
will list all the properties and their current values. Properties and their
possible values follow:
AxisMenuValues: {[x] [y] [z]}, Two or three element
cell containing indices or strings indicating which item, or items, to select
in each of the three axis pull down menus. In [x] or [y] a value of 0 (zero)
means to select index number. In [z] a value of 'none' means to not use the
z-axis.
AxisMenuDefaults: Axis menu defaults are axis menu
values used if the axis menu values can not be restored. The input format is
the same as axismenuvalues.
Figure: [scalar integer], Figure on which data should
be plotted {default is current figure}.
New: Key word – no associated PropertyValue.
Creates a new figure for display of data. This is equivalent to an initial
PLOTGUI call.
PlotBy: [scalar integer], Dimension (mode) for the
axis menu selections: 0 = special "data browser", 1 = rows, 2 =
columns, etc. (see View menu). The default is 2 or the number of modes
in the data if larger than 2-way.
VSIndex: [ 1 1] {default}, Two element vector
indicating if "Index" should be offered on x and y axis menus. A 1
indicates that it should be offered as a selection and a 0 indicates that it
should not e.g. [1 1] indicates that it should be offered for both the x-axis
and y-axis.
The following are image specific properties:
Image: Key word – no associated PropertyValue.
Unfolds a 2 or 3-way array and displays it as and image, allowing selection,
classing, and exclusion of individual pixels.
Unfold: Key word – no associated PropertyValue.
Pseudonym for “image”.
AsImage: Key word – no associated PropertyValue.
Display 3-way data that have already been unfolded as an image allowing
selection, classing, and exclusion of individual pixels.
The following are view properties:
ViewClasses: [1]
{default}, Turns on View/Classes menu. A 0 (zero) turns it off.
ViewExcludedData: [1] {default}, Turns on View/Excluded
Data menu. A 0 (zero) turns it off.
ViewLabels: [1] {default}, Turns on View/Labels
menu. A 0 (zero) turns it off.
ViewNumbers: [1]
{default}, Turns on View/Numbers menu. A 0 (zero) turns it off.
The following are plot properties:
LineStyle: <string>,
Defines line style (see PLOT).
PlotType: <string>, String used to select plot type
{default [ ] is
atuomatic selection}. Other values are 'scatter', 'bar', 'none'
('none' = do no
plotting).
SelectionMarker: <string>, Defines marker style
for selected points (see PLOT).
The following are selection properties:
SelectionMode: <string>,
Defines the selection mode. This can be any string listed under View/Selection
Mode above. Also see GSELECT.
BrushWidth: [scalar
integer number of pixels], This defines the brush width for use when selectionmode = 'paintbrush'.
See View/Selection Mode/Paintbrush.
NoSelect: [0] {default}, When set to 0 this allows selections.
When set to 1 no selection is allowed.
NoInclud: [0] {default}, When set to 0 this allows changes to
the inlclud field
(i.e. it allows data to be excluded). When set to 1 no changes to the inlclud field are allowed
(i.e. data can not be excluded).
The following are on-event properties:
CloseGUICallback: Command(s) to execute when the
figure is closed.
IncludChangeCallback: Command executed when includ
field of the dataset is modified.
InfoReqCallback: Command executed when information on
a selected point is requested.
PlotCommand: Command executed after plotting (e.g.
draw limits, assign ButtonDownFcns, modifiy axes, …).
SelectionChangeCallback: Command executed when a selction
is made.
SetClassCallback: Command executed when the class
field of the dataset is changed.
The following are confidence limit properties:
ConfLimits: Boolean
flag to make "Conf. Limits" controls visible. 1 = show controls (PLOTGUI does nothing with
these controls, thus the routine specified in 'plotcommand' must be
set to use values).
LimitsValue: Value
for Conf. Limits editbox.
ShowLimits: Value
for "Conf. Limits" checkbox (1 = checked).
The following are figure linking properties (WARNING!
Modifying these settings can lead to unexpected results!):
Children: Add new child of the current PLOTGUI figure (all child figures are updated
when their parent is updated and closed when their parent is closed). Note:
this property will only allow adding of additional children. Other
modifications must be made using setappdata.
ControlBy: Reassign
control for PLOTGUI
figure.
Parent: Assign a parental link (Forces the parent figure to
update if this figure is updated, also see 'Children').
TimeStamp: Time-stamp
of last time this figure was updated (can be set to any string to isolate
figure from updating by parents).
The following are other miscellaneous properties:
UIControl: Add
extra uicontrol(s) to PLOTGUI
control toolbar for use with current figure (buttons, sliders, etc.). The value
passed to UIControl
should be a cell in which each entry is the tag of a new object to create and
the value of that field should contain a cell of uicontrol property / value
pairs to set for that object. For example:
myobj.mybtn = {'style',
'pushbutton', 'string', 'new fig', 'callback', 'figure'};
plotgui('update','uicontrol',myobj)
creates a button with the
tag 'mybtn' on the
controls for the current figure.
If the cell for any
object does not contain a 'position'
property for the object, PLOTGUI
will manage the object's position.
The following are read-only properties. These properties can
only be viewed and are only accessible through the MATLAB getappdata command.
Selection: Cell
array of currently selected values. Usually the same format as "includ" field of
DataSet object where each cell represents the index of selected items in each
dimension {rows, columns, slabs, ...}.
When selecting elements
in greater than 2-dimensional data (and without the use of the 'image' keyword), two cells
of this field will be pairs of selected indices: {x,y,[]} or {[],y,z}.
FigureType: 'PlotGUI'
DataSet: DataSet used in figure (or pointer to figure with
actual dataset)
Note: This is set by
calling PLOTGUI with a
new dataset as an input. The actual DataSet can be retrieved using the getdataset command (see
below).
The following are other valid figure properties. See the
MATLAB doc umentation on FIGURE properties for additional information.
HandleVisibility, MenuBar, Name, NumberTitle, Position,
Resize, Tag, ToolBar, Units, UserData, Visible, WindowStyle
Examples
fig =
plotgui(mydata) plots mydata
allowing user to select which column(s) of mydata to plot using pull-down menus. Figure number
of plot is returned.
plotgui(mydata,'plotby',1)
or plotgui(mydata,'plotby','rows')
plots mydata as
in first example except that rows of mydata (dimension 1) are used for pull-down menus instead of
columns. Note: When a PLOTGUI
property is set for a given figure, the new value will be retained until a new
value for that property is provided, even if new data is plotted on the same PLOTGUI figure.
fig =
plotgui(mydata,'plotby',1,'axismenuvalues',{[1] [2 3]}) plots rows of mydata; sets controls with
row 1 selected for the x-axis and rows 2 and 3 selected for the y-axis. Use:
getappdata(fig,'axismenuvalues')
to retrieve current axis menu settings.
axispulldown
plotgui(mydata,'viewclasses',1)
plots mydata using
symbols to identify the classes stored in dataset mydata. Use a value of 0 (zero) to turn off
viewclasses.
plotgui('update','viewclasses',1)
Turns on viewclasses
property for current figure without having to pass data to plot (substitute
string 'update' for
data)
mydata =
plotgui('getdataset',fig) Retrieves mydata from figure fig.
plotgui(myimage,'image')
plots 3-way image myimage
selecting slabs of the image for display. The keyword 'image' allows selection, classing and
exclusion of pixels in the image.
See Also
analysis, dataset/dataset, editds, gselect, modelviewer, mplot, ploteigen, plotloads, plotscores